2021, day 1: Sonar Sweep ⛴️🔈
Another year of Advent of Nim 🎄👑!
This year I would like to try and use cool nim libraries for visualization and similar stuff. I will most likely be able to keep up only for a few days, but let's see.
But let's get to the first problem. As usual we have a sequence of integers as input.
What is new this year is that,
thanks to 1.6
we can use toSeq with method call syntax!
let input: seq[int] = "2021/input01.txt".lines.toSeq.map(parseInt)
echo input.len
echo input[0 .. 10]
echo input[^10 .. ^1]
2000 @[104, 105, 109, 120, 124, 113, 120, 121, 122, 123, 134] @[7678, 7680, 7692, 7712, 7724, 7730, 7736, 7737, 7746, 7759]
Part 1
As the submarine drops below the surface of the ocean, it automatically performs a sonar sweep of the nearby sea floor. On a small screen, the sonar sweep report (your puzzle input) appears: each line is a measurement of the sea floor depth as the sweep looks further and further away from the submarine.
For example, suppose you had the following report:
let report = """
199
200
208
210
200
207
240
269
260
263"""
This report indicates that, scanning outward from the submarine, the sonar sweep found depths of 199, 200, 208, 210, and so on.
The first order of business is to figure out how quickly the depth increases, ...
To do this, count the number of times a depth measurement increases from the previous measurement
... In this example, there are 7 measurements that are larger than the previous measurement.
The solution for part1 (as expected) is pretty straightforward. Just make sure you start from index 1:
func countIncrease(s: seq[int]): int =
  for i in 1 .. s.high:
    if s[i] > s[i - 1]:
      inc result

let testInput = report.splitLines.toSeq.map(parseInt)
doAssert testInput.countIncrease == 7
echo countIncrease(input)
1557
That's the right answer! You are one gold star closer to saving your vacation.
Part 2
Considering every single measurement isn't as useful as you expected: there's just too much noise in the data.
Instead, consider sums of a three-measurement sliding window.
... Your goal now is to count the number of times the sum of measurements in this sliding window increases from the previous sum.
... In [test] example, there are 5 sums that are larger than the previous sum.
let's create a function that copmutes the window function of a sequence, then we will apply previous function to the result.
func window(s: seq[int], size=3): seq[int] =
  assert s.len >= size
  var sum = s[0 ..< size].sum
  result.add sum
  for i in size .. s.high:
    sum = sum - s[i - size] + s[i]
    result.add sum

echo input[0 ..< 10]
echo input[0 ..< 10].window
@[104, 105, 109, 120, 124, 113, 120, 121, 122, 123] @[318, 334, 353, 357, 357, 354, 363, 366]
doAssert testInput.window.countIncrease == 5
echo input.window.countIncrease
1608
That's the right answer! You are one gold star closer to saving your vacation.
Optimizing part 2
As hinted by narimiran in our nim-aoc discord chat, there is a simpler way to compute part 2 that also reveals that the "window" approach does not really denoise the signal. Since two successive windows of 3 depths have 2 overlapping depth, to check if there is an increase we only need to check first and last depth:
func countIncrease2(s: seq[int], window=3): int =
  for i in 0 ..< (s.len - window):
    if s[i + window] > s[i]:
      inc result

echo input.countIncrease2
1608
Visualization
I will use the excellent ggplotnim to plot the depth profile and the dataframe library datamancer (implictly imported through ggplotnim) to manage the data. Thanks to Vindaar for help in this section
import ggplotnim
var df = seqsToDf({"depth": input}) # toDf(input): new column will be named input
df["x"] = collect:
for i in 1 .. input.len:
i
echo df
let
dark = parseHex("202b38")
gold = parseHex("ffff66")
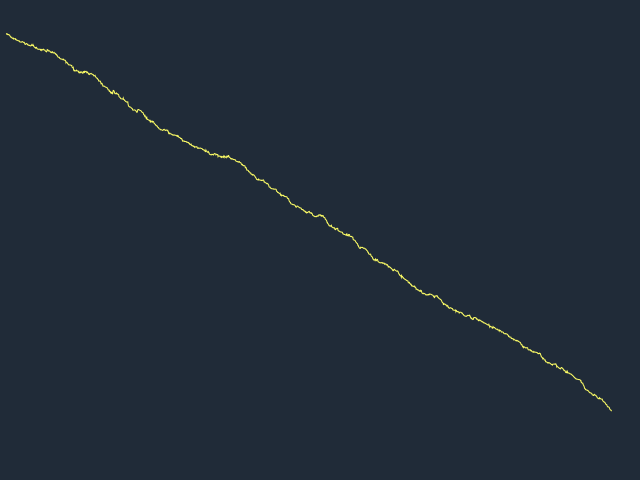
ggplot(df, aes(x="x", y="depth")) + scale_y_reverse() +
geom_line(color=some(gold)) + theme_void(color=dark) +
ggsave("2021/01_depths.png")Dataframe with 2 columns and 2000 rows:
Idx depth x
dtype: int int
0 104 1
1 105 2
2 109 3
3 120 4
4 124 5
5 113 6
6 120 7
7 121 8
8 122 9
9 123 10
10 134 11
11 133 12
12 134 13
13 150 14
14 160 15
15 165 16
16 179 17
17 178 18
18 180 19
19 178 20
INFO: The integer column `x` has been automatically determined to be continuous. To overwrite this behavior add a `+ scale_x/y_discrete()` call to the plotting chain. Choose `x` or `y` depending on which axis this column refers to. Or apply a `factor` to the column name in the `aes` call, i.e. `aes(..., factor("x"), ...)`.
StatusSuccess output of write_to_png
Note:
- we use
seqsToDfand a table constructor in order to give a new name to input - we built (using sugar's collect) a dummy x axis in order to use it in the plots
- we reverse y scale to give the idea of increasing depth of sea bottom
- we use a gold line and same background as that of the page, removing all axis
- colors come from chroma
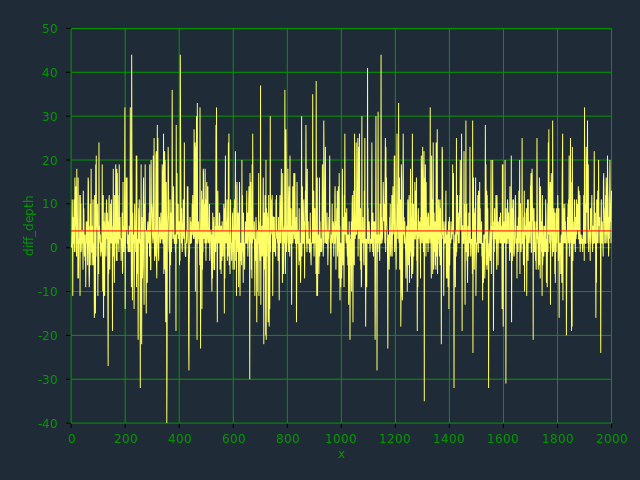
Interesting also to plot the depth differences (and its average, which we can expect to be close to 4):
df["diff_depth"] = collect:
  for i in 0 .. input.high:
    if i == 0:
      0
    else:
      input[i] - input[i-1]
let mean_diff_depth = mean(df["diff_depth"].toTensor(float))
dump mean_diff_depth
echo df
let
  green = parseHex("009900")
  red = parseHtmlName("red")
let
  font_aoc = Font(
    family: "sans-serif",
    size: 12.0,
    bold: false,
    slant: fsNormal,
    color: green,  # only change with respect to default
    alignKind: taCenter
  )
  theme_aoc = Theme(
    canvasColor: some(dark),
    plotBackgroundColor: some(dark),
    gridLineColor: some(green),
    labelFont: some(font_aoc),
    tickLabelFont: some(font_aoc),
    # hideTicks: some(true)  # with this line:
    # fatal.nim(53Error: unhandled exception: index out of bounds, the container is empty [IndexDefect]
  )
ggplot(df, aes(x="x", y="diff_depth")) +
  geom_line(color=some(gold)) + theme_aoc +
  geom_linerange(aes = aes(y = mean_diff_depth, xMin = 0, xMax = 2000), color=some(red)) +
  ggsave("2021/01_relative_depth.png")
mean_diff_depth = 3.8275
Dataframe with 3 columns and 2000 rows:
Idx depth x diff_depth
dtype: int int int
0 104 1 0
1 105 2 1
2 109 3 4
3 120 4 11
4 124 5 4
5 113 6 -11
6 120 7 7
7 121 8 1
8 122 9 1
9 123 10 1
10 134 11 11
11 133 12 -1
12 134 13 1
13 150 14 16
14 160 15 10
15 165 16 5
16 179 17 14
17 178 18 -1
18 180 19 2
19 178 20 -2
INFO: The integer column `x` has been automatically determined to be continuous. To overwrite this behavior add a `+ scale_x/y_discrete()` call to the plotting chain. Choose `x` or `y` depending on which axis this column refers to. Or apply a `factor` to the column name in the `aes` call, i.e. `aes(..., factor("x"), ...)`.
StatusSuccess output of write_to_png
Note:
- to compute the mean we use
toTensorand we convert to float (otherwise the result will be anint) - we create a custom "aoc" theme setting appropriately colors
- we are using
geom_linerangeto plot the horizontal line sincegeom_hlineis not (yet) implemented
highlights from subreddit
Among the different stuff that is published in advent of code subreddit I found interesting:
- a site that allows to search all solutions posted in the solution megathread by programming language (announcement)
- a visualization of a solution built with Turing Complete, a game coded in Nim